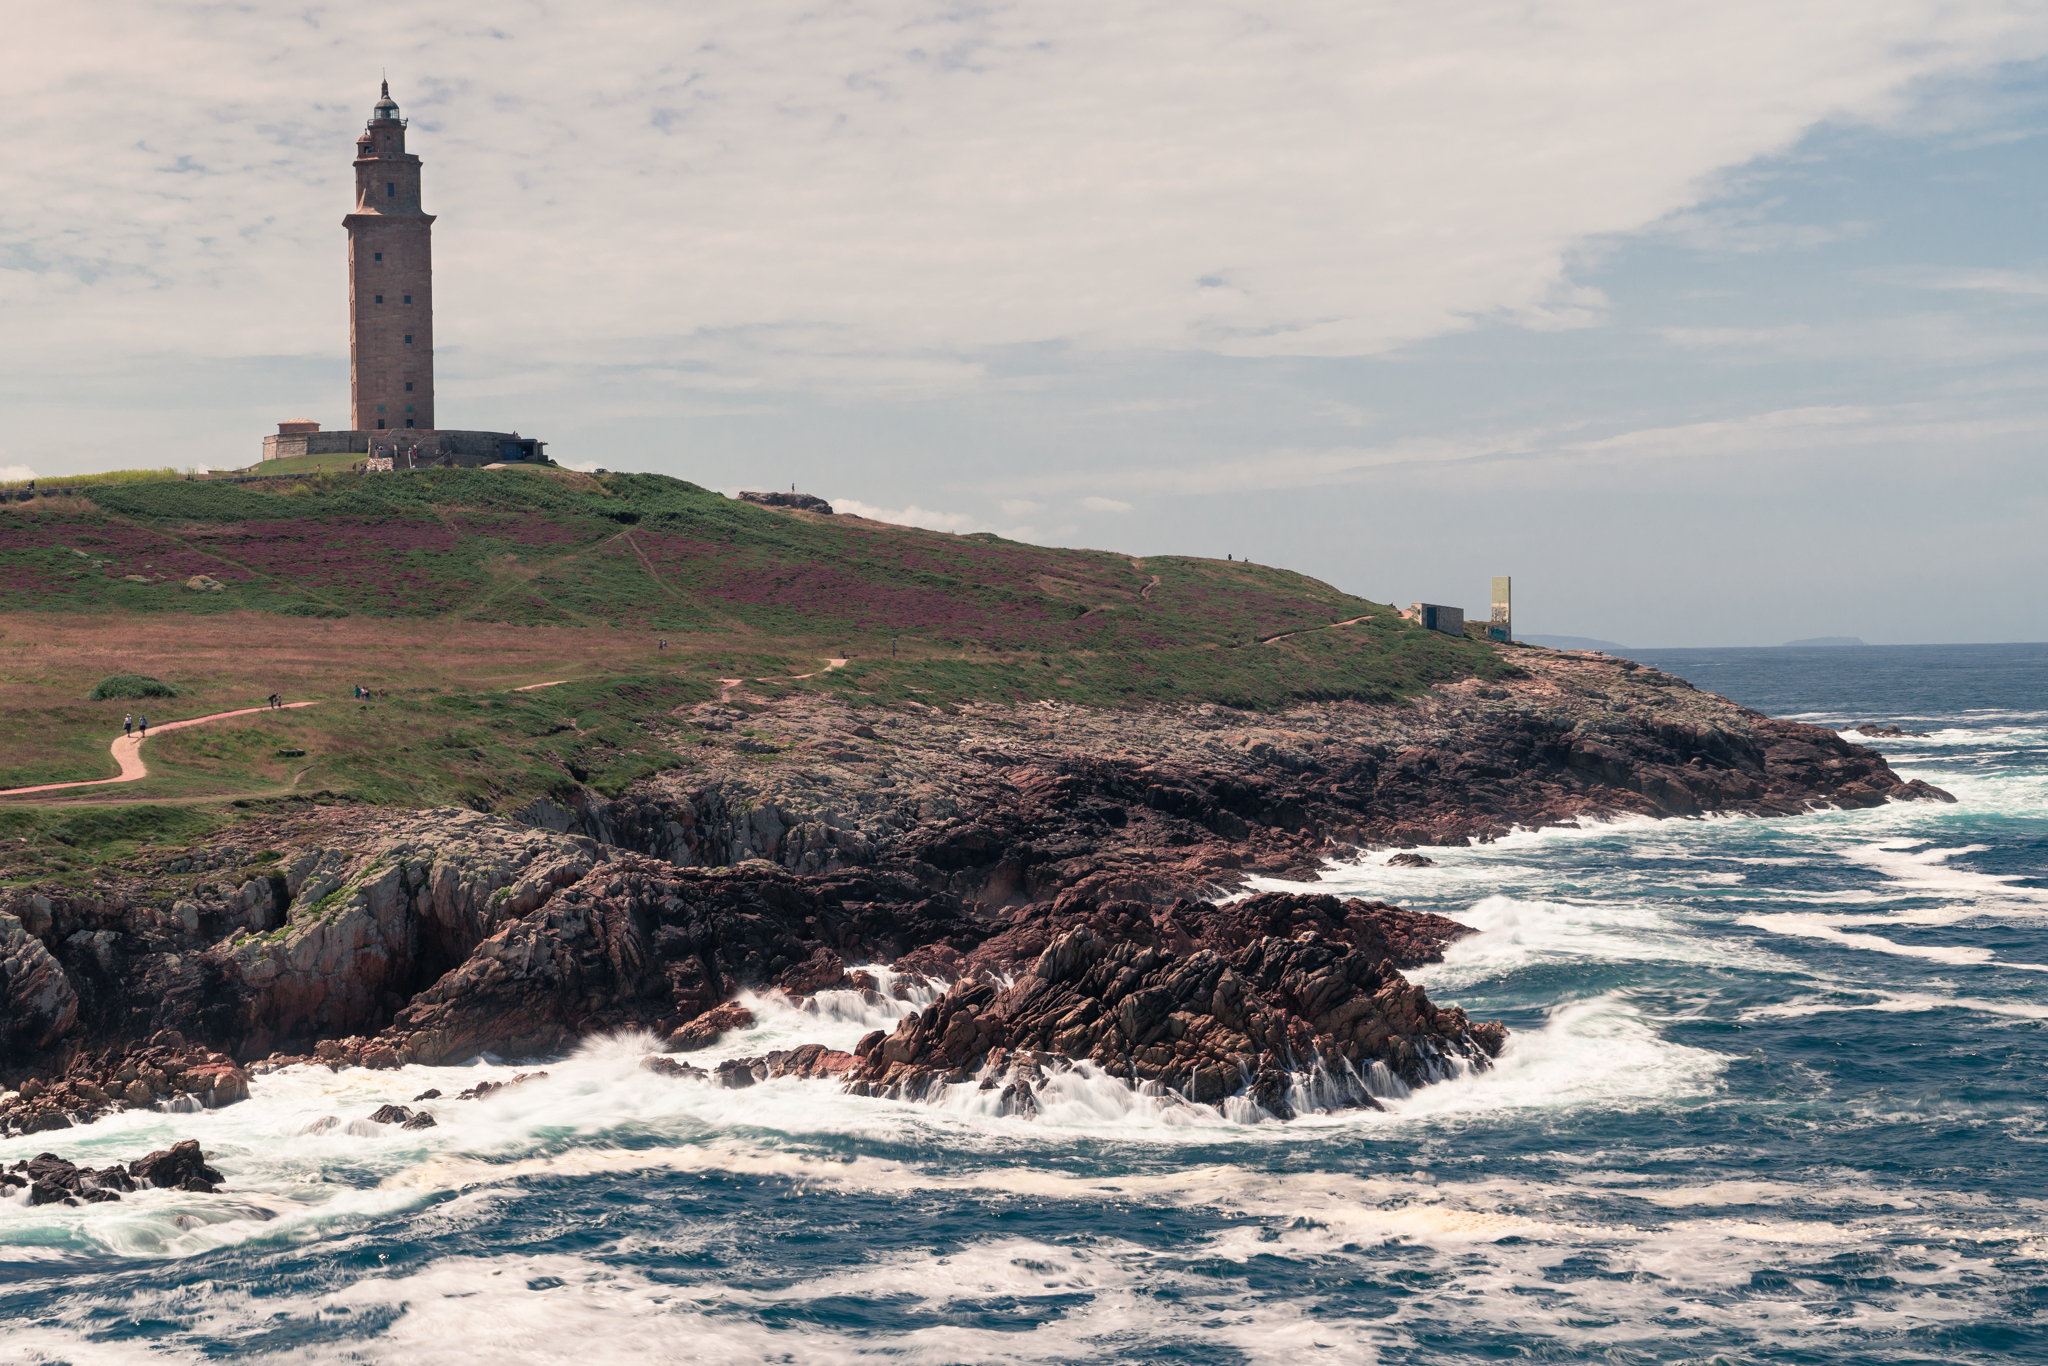
Lighthouse shown in the picture above is the Torre de Hercules in A Coruna.
During our last trip to Galicia, we visited the Bares lighthouse. Next to the lighthouse situated at the northerst point of Spain, a sign summarized some of the key statistics of the lighthouse. Latitude, longitude, light charasterictics and more. Seeing this sign made me wonder if this data was available somehow. Which it of course was. (source: wikidata.org)
After scraping the data the only thing left to do is create a Folium map visualizing the data. Thanks to some nifty tricks to help create the popup html, the following result came out.
Some insights on the features shown in the popup source(wikidata.org):
- Building Height: height, human height and body length: vertical length of an entity
- Focal Height: focal height of lighthouse: height of the lamp of a lighthouse from water level
- Light Charasteristic: light characteristic: description of a navigational light sequence or colour displayed on a nautical chart. Explicitly state white light (W)
- Range: The distance at which the light can be seen. If the light has colors, there will be several ranges, one for each color. Use qualifier “color” (P462)
Full code on github.
Click/tap on a yellow dot for more information and a picture of the lighthouse.